Cost Optimizing Azure Monitor
Blogpost about cost optimizing Log Analytics monitoring for Azure Spring Clean 2025.
Insight into your platform can be of huge benefit to both operations, developers and the security team, but logging to much can result in high costs. How can you optimize logging and monitoring to pay for only what you need. There are several ways to save on logging and some patterns and anti-patterns to be aware of to not overspend on logging. Let’s look at that now.
Before we start, I would like to thank Thomas Thornton and Joe Carlyle who are once again hosting the Azure Spring Clean! And don’t forget to check out the other amazing contributions to the community event over at the Azure Spring clean website.
One or many workspaces?
The first question that you need to take into account when looking at optimizing your loggingstrategy is “Do I need all my logs in a central workspace?”. There are some benefits to having all your logs in one workspace, and it used to be a recommended best-practice from Microsoft in the Azure Landing zones reference architecture. Having a central workspace makes it easy to have a single pane of glass for all your logs from the whole platform. It was also recommended to use this workspace for Sentinel. There was one big backside to this; it was expensive. When you activate Sentinel on a workspace, you double the cost for ingesting logs. Now, you would get the first 90 days of retention for free, compared to the 30 days with a regular workspace, but luckily there are now other features that can help us keep the first 90 days of retention low, but we will get to that.
So you now pay double for ingesting all your logs into the central workspace with Sentinel activated, but at least you can now have your security team simply monitor and query all the logs from the platform. Thats good right? Well, are all Azure logs vital or even related to security? No. Metrics and application insights logs are some of the larger log tables we have and usually they don’t really matter for security.
Another topic is that for Sentinel, you usually want a longer retention for those logs. Sometimes it’s for regulatory reasons, other times for practicality. Do you don’t need more than 3 months of metrics from your app service or no need to keep those application exemptions from 6 months ago in your logs? The answer is probably not and therefore it might not be optimal to have all you logs in Sentinel.
So now I have given some arguments for why you should use more than 1 workspace, let’s have a look at the usual arguments that I have heard for why you should have 1 single workspace:
“We need to have all our logs in the central workspace to break even on our commitment for ignestion per day”. This is a fair reason that I can see why someone would make, but it isn’t necessary to have all logs in the same workspace to have the commitment. There is something called a dedicated cluster in Azure monitor. A dedicated cluster is just a virtual cluster where you can link all your Log Analytics workspaces and have a single commitment for all the ingestion logs. I must emphesise that a dedicated cluster does not have a Pay-as-you-go pricing, so you should only create a dedicated cluster if you exceeed the break even point of the minimum ingestion commitment tier of 100GB (You need around 70GB ingested per day to break even) or if you need some of the enhanced features like for example encryption using Customer-managed keys or ingesting data directly from Event Hubs.
“We need to join different tables in queries for non-security logs”. This used to be a very valid argument, but the product team at Microsoft has created a solution for this as well. You can now do queries cross workspaces. This means that your logs can be located in different workspaces and still be used in the same query. This will make it easier to pay less for ingestion by splitting logs into seperate workspaces and still query them together if you need to. Now, doing cross workspace queries can slow down more advanced KQL queries, but if you have the workspaces linked to a dedicated cluster, you will get better performance for cross workspace queries.
So, how many workspaces should you create? That depends! Like the annoying consultant I am, I won’t give you an exact number, because it can differ based on your specifications. Do you need granular access control? Probably need more of them to ensure that personel with needs still can access only what they need. Do you want to minimize management? Probably fewer. The only recommendation here is that you need more than 1.
Analyzing usage
Right, let’s move into something more practical. You have a workspace that is costing you loads of money per month, how do you actually get insight into what logs are costing you the most. Here we need to look at some wueries that can help us. We will start to look at a log table called Usage. These logs are like the name implies, logs that tell us something about our usage and mostly ingestion. All logs in LAW have a column called "_IsBillable" and a _BilledSize". Not all logs ingested into Log Analytics actually costs money and the logs have different sizes depending on the amount of data in them. If we use these logs we can get insight into what we are logging and what is costing us the most amount of money. Have a look at the query below:
Usage
| where StartTime >= startofday(ago(31d)) and EndTime <= startofday(now())
| where IsBillable == true
| summarize BillableDataGB = sum(Quantity)/1000. by bin(StartTime, 1d), DataType
| render columnchart
This query will give a result that looks like this:

Here, our usage is broken down into what table have sent how many GBs of data to workspace in the last month, broken down into per day. Getting insights into what tables generate the most logs, we can then drill down into those tables to see what types of logs and what resources send the most logs. Just like the _IsBillable and _BilledSize columns, all logs in Azure also have a column called _ResourceId. And using that column we can create queries to find out which resource have been sending the most logs to our workspace.
Using my example above, where there was a table called “AVSSyslog” that were sending data, I can use the following query to see who the guilty resource is:
AVSSyslog
| summarize count() by _ResourceId
When you have the resource that is sending the most, you can dig down into them to find what type of logs and see if there is any way to optimize that logging.
Move to resource-specific logs
Most of the Azure resources have logs have historically used Azure diagnostics to send the logs into Log Analytics workspaces. The Azure diagnostics have therefore been it’s log table to make it easier for product teams to create a log schema for all resources. The negative side is that with a standardized schema is that it’s not always structured well and some teams have dumped loads of data into a single column. This have lead to the logs being larger than they needed to be. To combat this, Microsoft have created a new collection mode in Azure diagnostics called “Resource-specific logs”. These are part of a new strategy for all resources to have their own log tables in Log Analytics. By seperating logs into their own log tables, you can optimize each log table by having different retention periods, table-specific RBAC, different table plans and filter ingestion by using table transformation.
In addition to giving you more flexibility, some product teams like the Azure Firewall team can brag about reducing the billable size of the logs by 70%! And that is while also making the logs simpler to query and adding new fields with more data. Unfortunately, not all resources support resource-specific logs yet. You should out the documentation from Microsoft to get the newest list of supported log categories.
For the logs that you can move to resource-specific, we will now look at what other ways we can utilize them to lower costs even further.
Log table plans
As we have talked about already, not all logs are born equal. Not all logs are as important and therefore, Microsoft has made it possible to have different types of plans for the logs in Log Analytics. The default type is the “Analytics” logs. These logs are always available in hot storage and have all the features from KQL and Azure Monitor. As of writing this post, there are 2 more table plans with one of them being still in preview. You have the Basic and Auxilliary(preview) table plans. These plans are made for the “less important” logs. They have more limited features in Log Analytics, but are cheaper to ingest. On the other hand, these plans have a seperate price for actually querying the logs. Meaning like most storage tiers in Azure services, you can chose to have data not as frequently accessed on cheaper storage, but it will cost you to access it. Becuase of this, not all logs should be moved to Basic or Auxilliary table plans, and not all logs can either.
Microsoft have these recommendations for what type of data the different plans are best for:
- Analytics: “High-value data used for continuous monitoring, real-time detection, and performance analytics.”
- Basic: “Medium-touch data needed for troubleshooting and incident response.”
- Auxilliary: “Low-touch data, such as verbose logs, and data required for auditing and compliance.”
Checkout this link for a full comparison of limitations for the different plans.
Table Transformation
Lastly, we will look at table transformation. This is a feature we can use on some log tables to actually filter and change logs as they are being ingested. Meaning that we can lower the ingestion cost be filtering away logs with specific column values or remove a set of columns we don’t need. Again, this is a feature that is limited in supported log tables and therefore not possible to do with all logs. Here is a link to the newest information from Microsoft on supported tables.
These transformations rely on KQL to transform the data. Therefore, we will mostly use operators like where, project and project-away. to transform them. But it is also possible to use more advanced operators to create new columns or remove parts of data in a existing column. Today we will only look at filtering away data.
By using the where operator, we can select or select away logs that have a specific value. A good example here can be to filter away event logs from VMs that are informational. The Windows event log contain lots of logs and a majority of them are only for information. Therefore, it might be useful to filter them away to prevent them from filling up your workspace. Optionally, you can use the where operator to have an ignore list of certain type of logs. For example, ignoring specific Event IDs from VMs. To do this you can use the following KQL syntax | where column1 != "valueX".
Another alternative is to use project or project-away to select which columns to ingest from the logs. The 2 operators are quite simple, with project you can select which columns you want to include and with project-away you select columns you want to remove. This can be a good way to remove columns that contain duplicate data or data that are not essential for your use.
You can transform the table ingestion by going to the tables setting on your log analytics workspace, there you need to find the table you want to transform and press the three dots all the way to the left to bring up the context menu. If the table supports transformations, you should be able to click the Create transformation option.
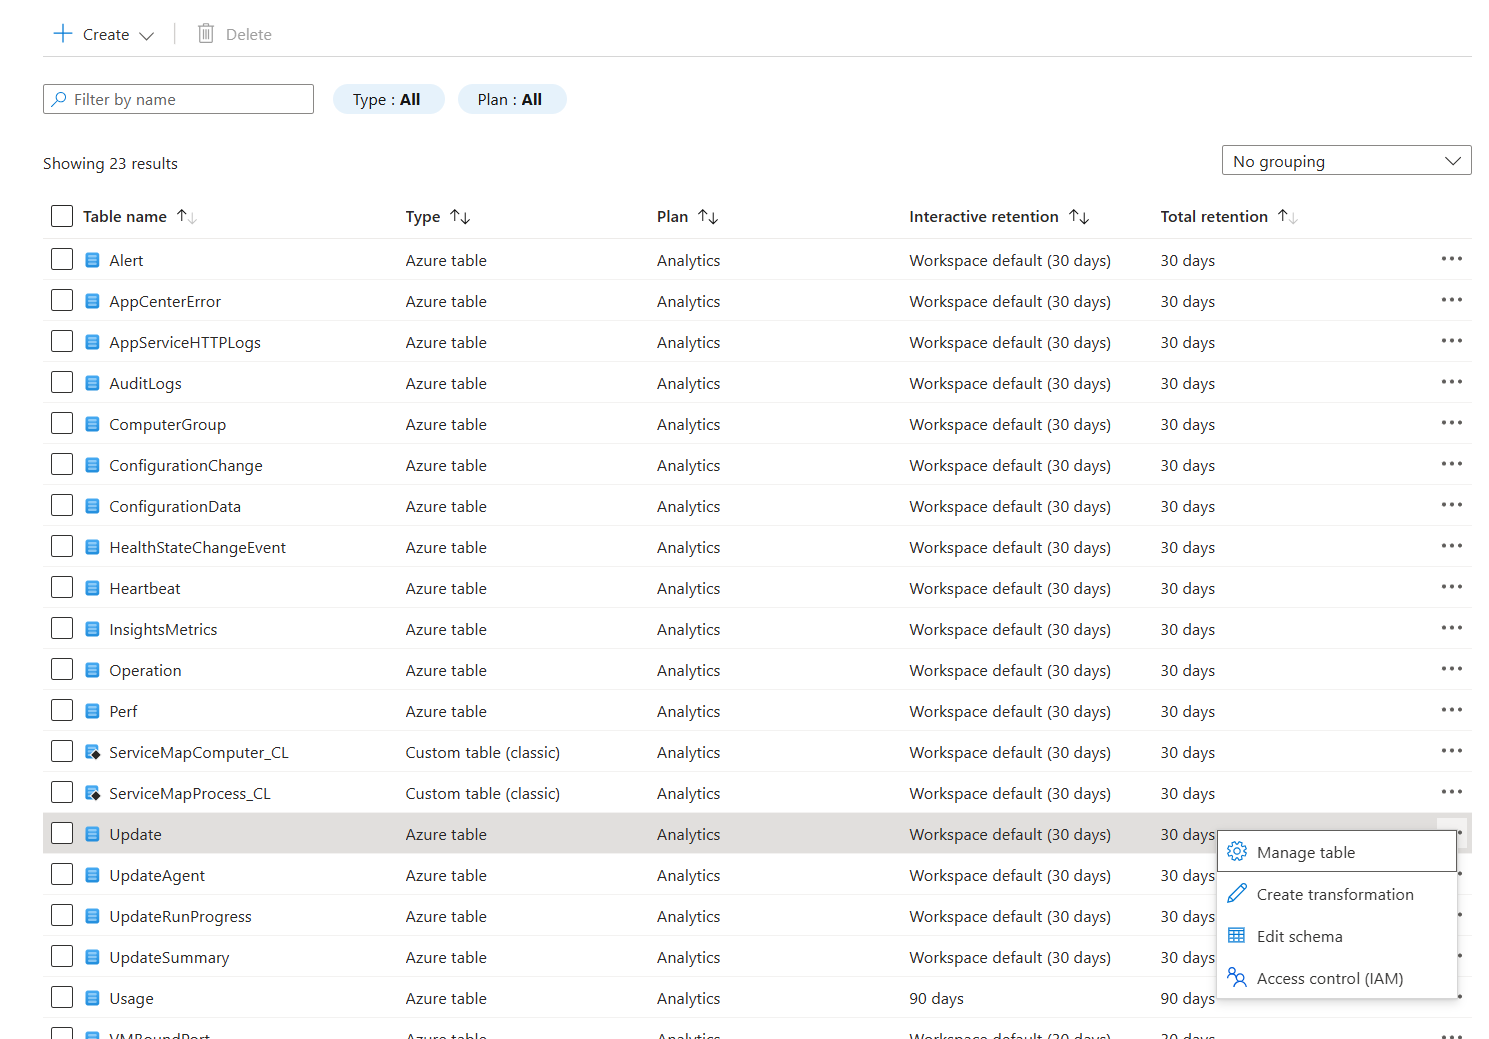
Here you need to select or create a data collection rule that will be used to transform the logs. When you have done that, click the button to open the Transformation editor. This is where you can add your KQL operators to edit or filter away logs before they are ingested into your workspace.
Summary
Today we have looked at some ways to cost optimize your logging in Azure. Using this new knowledge, you should now be able to look into why your Log Analytics Workspace is expensive and how to reduce the cost. This was a fair bit longer post as this is a shorter summary of a talk I had some weeks ago. The plan is to have that talk again some time as it will be much better with more demos and more show than tell.